Andres Clavier Studio

Uncategorized

Power Law

Article March 2026 Fundraising is not normal, and I mean that statistically. I don’t mean that it’s strange, or difficult, or unique — though it is all of those things. I mean that statistically, fundraising growth does not follow a Normal Distribution. And this changes everything. We are all taught to think in Bell Curves. In a Bell Curve world, most data points cluster around the average — the mean. Human height is a Normal Distribution: if you take the average height in a group, most people would be more or less that average, and you will never meet a man who is 100 feet tall. But I have been analyzing charity donation records, and the most important KPI — Donor Lifetime Value — is always definitely closer to a Power Law. With some rare and interesting exceptions. In a Power Law, the magnitude of outliers is tied to sample size This has so many implications. I could write endlessly about this, but I’m sticking with one this time. You can’t retain a tail donor you never acquired. And you can’t predict who becomes a tail donor from their first gift. The retention advice that’s dangerously incomplete For years I have heard peers say “you don’t have an acquisition problem, you have a retention problem.” I think this advice is built on Bell Curve thinking. They’re telling charities to optimize the middle — squeeze more from existing donors, reduce churn, and improve retention rates. But if donor LTV follows a Power Law, the game isn’t only about retaining average donors better. Specially for younger, smaller charities, the game is about finding more people who could become tail donors — and these are your monthly, loyal, or high-value folks. And you can only find those people through acquisition. Through advertising. Through casting a wider net. Most retention advice isn’t wrong, but it’s incomplete and dangerously misleading. Charities don’t need to choose between acquisition and retention. But right now, the scale is tipped too far in one direction. It makes charities underinvest in the one thing that feeds the Power Law: having more people know about you and remember you. The industry already admits this (halfway) To be fair, the nonprofit sector intuitively understands the Power Law. We see it in how we structure our teams. We hire Major Gift Officers. We build entire departments dedicated to the top 1–5% of the file. We accept that a donor who gives $100,000 requires a fundamentally different operational approach than a donor who gives $50. We don’t send the $100K donor a window-envelope appeal; we take them to lunch. We operationally accept the reality that 10–20% of the donors provide 80% of the revenue. So we have accepted the Power Law in our staffing. But we completely ignore it in our budgeting. The budgeting blind spot When it comes to marketing budgets, most charities suddenly develop amnesia. They stop thinking in Power Laws and start thinking in Bell Curves again. They look at Direct Mail and Email. They obsess over “average response rate,” “average gift,” and “average cost per acquisition.” They pour the majority of their budget into these channels because they are efficient, predictable, and “safe.” They invest heavily in retaining the middle of the curve, but they chronically underinvest in Acquisition, Paid Media, and Out of Home. This is a mathematical disaster. Here is why. The math of discovery In a Normal Distribution, increasing your sample size doesn’t change the range of outcomes much. If you measure 100 people, the tallest might be 6’8″. If you measure 10,000 people, the tallest might be 7’2″. The ceiling is hard. But in a Power Law, the magnitude of the outliers is mathematically tied to the sample size. The more people you reach, the higher the probability of finding a “Black Swan” — that one donor who changes the trajectory of your entire organization. Direct Mail and Email is a closed loop. You are fishing in a small pond. You are optimizing for efficiency, but you have capped your discovery potential. Paid Media and OOH is the open ocean. By drastically increasing your reach, you are not just getting “more volume” — you are statistically increasing the likelihood of capturing an extreme outlier. Efficiency vs. magnitude The problem is that Paid Media looks “inefficient” on a spreadsheet compared to Direct Mail. The CPA is higher. The initial retention is lower. But this view is shortsighted. It assumes that every new donor is an “average” donor. If you believe in the Power Law, you don’t care about the efficiency of the average. You care about the probability of the extreme. When you starve acquisition to feed direct mail, you are making a choice. You are choosing to be efficient at being small, rather than accepting the volatility required to become massive. Stop optimizing for the average. The average donor doesn’t move the needle. Hunt for the tail. The strategic shift We need to align our budgets with our staffing. We already know that the “Head” of the curve drives the mission. We have the Major Gift Officers ready to steward them. But we are starving the engine that finds them. It is time to stop viewing Paid Media and Mass Awareness as “wasteful” spend that diverts money from the program. In a Power Law world, broad acquisition is the R&D cost of finding the donors who make the program possible. In a Power Law — or Pareto — distribution, the “average” doesn’t actually exist in a meaningful way. The tail is long, and the head is massive. A tiny percentage of events accounts for the vast majority of the impact. Stop optimizing for the average. The average donor doesn’t move the needle. Hunt for the tail. Ready to cast a wider net? Book a free discovery call © 2026 Andres Clavier Studio LinkedIn
What Makes A Good Charity Social Media Ad?

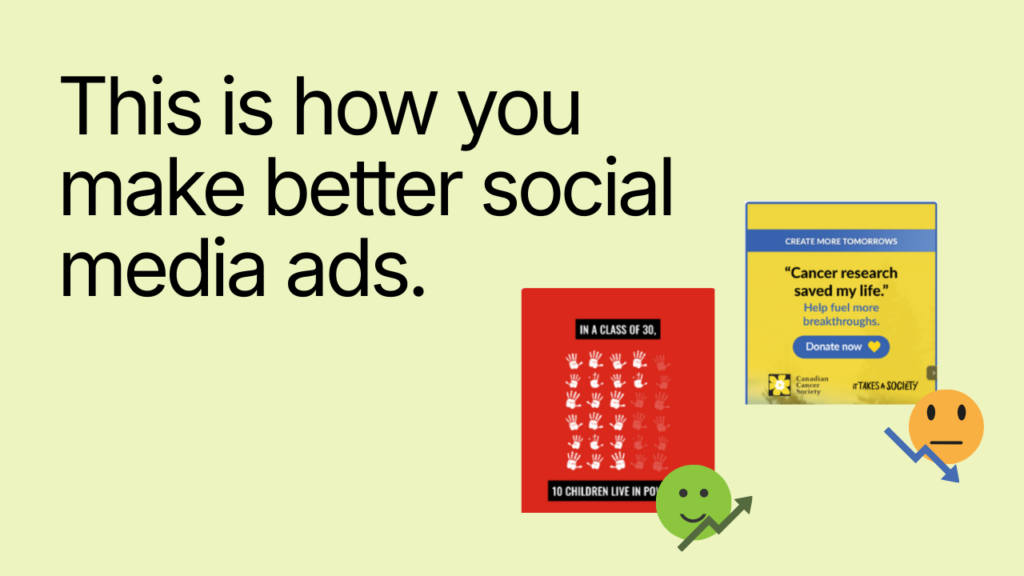
What makes a good social media ad for a non-profit? Most charity ads look like this: “$25 helps someone like John…” followed immediately by a big “Donate Now” button. Is this a bad ad? No. It can actually work quite well. However, it only works for a very small segment of people: those who are already familiar with your organization. Here is the problem: Chances are, most of the people scrolling past your content don’t know who you are. They don’t understand the depth of the problem you are solving, or the solution you need support to realize. If you treat a stranger like a loyal donor, you will lose them. If you want to grow and scale beyond your existing circle, you have to start speaking to broader audiences. Therefore, your goal shouldn’t be to make “one perfect optimized ad.” It should be to build a diverse portfolio of ads that connect with people at different stages of their journey.   The 5 Levels of Donor Awareness To fix your ad strategy, you need to diversify your creative approach based on Awareness Levels. Adapted from a framework by Dara Denney specifically for the charity sector, here is how you should be tailoring your content based on where a user is in their journey—from completely unaware to ready to donate. 1. The Unaware Stage The User Journey: These users are not thinking about the problem or your cause yet. They are scrolling for entertainment or connection. The Market: This is your Most Scalable audience. Best Formats: Pattern Interruption: Visuals that stop the scroll. Educational Content: content that teaches rather than asks. Humor/Celebrity Content: Leveraging familiar faces or lighthearted engagement to make an introduction. 2. The Problem Aware Stage The User Journey: These users recognize that a problem exists. They feel some emotional or personal tension around the issue, but don’t know what to do about it. Best Formats: Shocking Statistics: Data that visualizes the magnitude of the issue. UGC Single Testimonials: Real people talking about the issue. Founder’s Story: The personal “why” behind the mission. Identity-Based Content: Content that says, “If you are this type of person, you care about this.” 3. The Solution Aware Stage The User Journey: Users understand the problem and know that solutions exist. They are beginning to consider whether supporting a solution (not necessarily your solution yet) aligns with their values. Best Formats: Before and After: Visual proof of change. Program Highlights: How the work gets done. Beneficiary Testimonials: Stories from those who have been helped. Impact Statistics: The tangible results of the solution. 4. The Organization Aware Stage The User Journey: Users are aware of their problem, the potential solutions, and potentially how you compare with other non-profits. They are vetting you. Best Formats: Transparency Content: Showing where the money goes. 3 Reasons Why: Clear arguments for why your organization is the right choice. Differentiation: What makes you unique compared to other orgs? Donor Testimonials: Social proof from people just like them. 5. The Most Aware Stage The User Journey: These users know your organization, trust your work, and understand your impact. They are deciding when and how to act. The Market: This audience is Most Likely To Convert. Best Formats: Direct CTAs: “Donate Now” or “Join us.” Offers: Matches or specific giving tiers. Awareness Days: leveraging timely events (e.g., Giving Tuesday). Peer-to-Peer Events: Community fundraising. The Takeaway Stop trying to force the “Most Aware” strategy on “Unaware” audiences. When you look at the table above, you’ll see that the vast majority of the market exists in the first three stages. If your only ad strategy is a direct ask, you are ignoring the people who need to be educated and inspired before they are ready to give. Build a portfolio of ads that paints a picture for every person, no matter where they are in their journey. That is how you scale impact.

LUTW

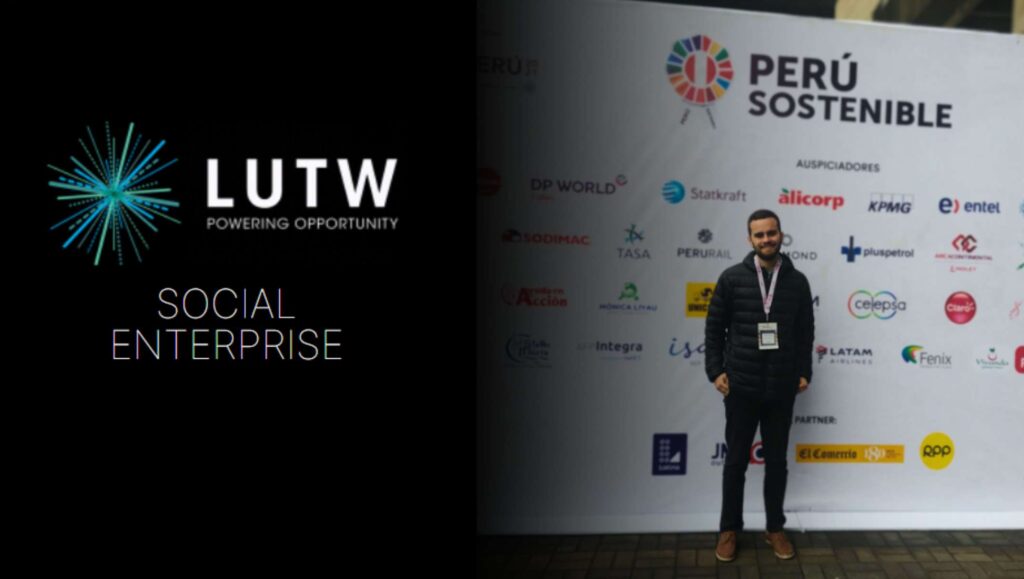
During my time at Light up the World, I had the opportunity to work as an awarded intern through a leadership program for Global Affairs Canada. I was tasked with supporting logistics to manage the offices in rural Peru. The goal of these offices was to take on the sales of solar energy systems for people who didn’t have electricity and were using fuels and candles as their primary light sources.

Papelmania

I took the role as a programmer and financial strategist for Papelmania, my wife’s kraft brand and e-commerce site; I have been instrumental in developing and implementing advanced automation to streamline business operations. Papelmania ranks in Peru’s top page of scrapbooking sites and has helped cement its positioning as a quality brand.

profitability app

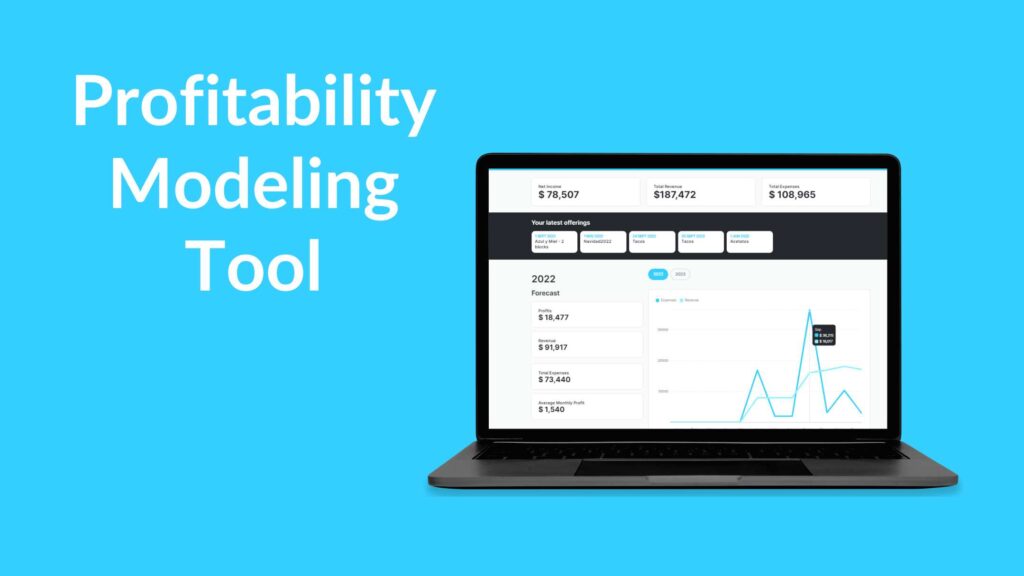
This was a project for Seven25 and its accelerator program Protagoniste Network. This was born after I noticed how many businesses struggle to define if their ideas for products make business sense.  The calculator replaces complex and messy excel sheets in a neat and user friendly UI.

advert

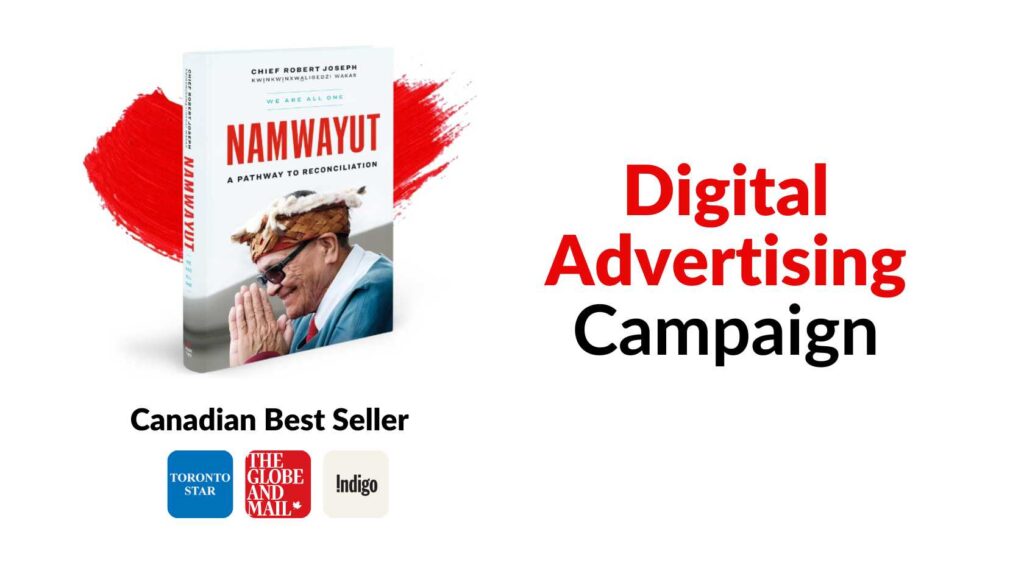
I was lucky to work with Reconciliation Canada and Page Two in promoting the beautiful work of Chief Joseph Robert. This book came at a time when Canada needed a message of peace and reconciliation, and I had the meaningful mission to reach as many as possible with on a tight budget.

Joga

JOGA allows users to browse and reserve their spot at sports events that match their level and at their favourite times and locations.

At the same time, organizers can promote their events, track payments and control attendance.
JOGA integrates well with WhatsApp so organizers can keep their attendees up to date.

Palta3

Co-Founding Palta3 Uncategorized (6) Overview Last November, I joined Cristian O’Ryan, an awarded social entrepreneur from Chile on his mission to accelerate Climate tech in remote and underserved communities in Latin America.Through our own experience, literature review and surveys we identified the need for inclusive financing options for farmers in the last mile to adopt solar energy.We are working with agile methodologies and bi-weekly sprints. To date we were able to establish key partnerships with agroindustrial export firm EGA in Peru and we made it to second rounds of highly competitive grants Expolive Dubai, Unicef Ventures Fund, and  EWOR. Landing Page Built in only a couple hours using Softr/Airtable.It includes our story, contact info, demo links, and DAO constitution. Prototype You can search for the related keywords here and find the desired result as per your preferences. Pitch Deck You can search for the related keywords here and find the desired result as per your preferences. Challenge Less than 2% of farmers in Peru are using solar energy and spending up to 20% of their annual income, the main barrier being the high upfront costs and the lack of financial services.Currently there are no viable methods to allow international investments in these projects. The Solution A Fintech that makes it possible to finance productive renewable energy projects through cryptocurrency so that small farmers can improve their productivity, reduce costs and promote sustainability.  My Role Product Designer/ Marketing, fundraising and Business Development/ Web Developer and app developer 1 Research and Ideation 2 Concept Development 3 Prototyping 4 Validation 5 Measure, Learn and Iterate Research and Ideation I conducted extensive research to better understand the our strengths, weaknesses, and opportunities. By analyzing last mile needs, market trends and competitors, I identified several key areas where Palta3 could fill the gap. Stakeholder mapping Field Evaluations Case Studies Prototyping I conducted extensive research to better understand the our strengths, weaknesses, and opportunities. By analyzing last mile needs, market trends and competitors, I identified several key areas where Palta3 could fill the gap. Market Validation I conducted extensive research to better understand the our strengths, weaknesses, and opportunities. By analyzing last mile needs, market trends and competitors, I identified several key areas where Palta3 could fill the gap. Measure, learn and Iterate